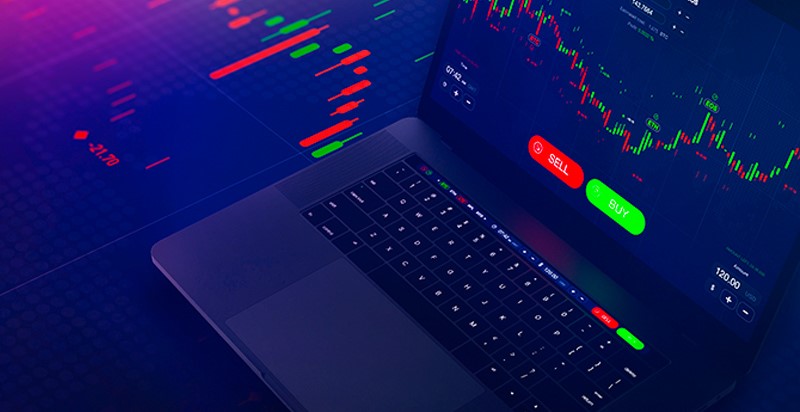
One of the most common questions new Forex traders ask is, ‘What’s a candlestick?”. And, while the question itself is fairly simple, the answer can be as long or short as you like. At Vertex Investing, we prefer the long answer and we are going to do our best to explain just what candlesticks are and how they can help you become a successful Forex trader. Let’s get started:
What Is A Candlestick?
So, just what is a candlestick? A candlestick can be defined as something that ‘shows an asset’s price movement over a set amount of time. This can be anywhere from a minute to a day, depending on the price chart.’ Four different price levels will be displayed within that specified time period: the lowest point in an asset’s price, the highest point, and the open and close prices.
How To Read Candlest successful Forex trader,icks
Reading candlesticks is not as difficult as understanding them. To read a candlestick, you look at its colour, its body and its wicks. To become a successful Forex trader, you will need to know how to read each of these factors so you can identify and predict market movements.
Colour Of The Candlestick- the colour of a candlestick is used to indicate the way in which a market has previously moved or is currently moving. The chart will be green if the close price is higher than the open price, and red if the close price is lower than the open price. When reading a candlestick chart, we read from left to right with the candlestick on the far left being from the oldest trading period, and the one on the far right representing the current trading period.
Candlestick Chart- if you see a candlestick chart in which the candlesticks are filled and not filled, rather than being green and red, you read it as the unfilled or white candlestick is a green candlestick, and a filled or black candlestick is as a red candlestick.
Body Of The Candlestick- Forex traders use the body of a candlestick to show the difference between an asset’s open and close price. The body of a green candlestick represents the opening price and the top represents the closing price. However, the opposite is true if the body of the candlestick is red.
Contact Vertex Investing
To learn more about candlesticks in Forex trading, contact Vertex Investing today and speak with an expert who can assist you and answer any questions you might have.
If you enjoyed this article, please feel free to share it on your favourite social media sites.

